Google published a video tutorial with seven tips for using Google Trends to research and share keyword and topic data. The tutorial shows how to find hidden filters and search tools in the Trends interface and explains how they help identify actionable data.
The seven ways to explore and share are:
- Punctuation
- By Language
- Comparison Functions
- Seasonality Discovery
- Year Over Year Trends
- Interest By Country
- 3 Ways To Export Or Share
1. Punctuation For Finding Hidden Insights
Omri Weisman, Google Trends Engineering Manager, shared how to use advanced search operators to dig deeper into the data and extract actionable user query insights.
He presented an overview of three advanced search operators:
- A. Quotation marks
- B. Plus operator (the + sign)
- C. Minus operator (the – sign)
He started with the example of search a two-word keyword term without punctuation, explaining that the keyword query volume data is for both words in any order. He also pointed out that no misspellings, variations, or plural versions are included in the search volume data.
A. Quotation Marks
The first search operator he discussed was the quotation mark. The quotation marks shows data for the exact match phrase, including when embedded as part of a larger phrase, with words before or after the exact match search query.
B. Minus Sign
Adding a minus sign to a search phrase filters out the word that’s modified with the minus sign, like this:
Keyword -Phrase
In the above example the word ‘phrase” will not be included in the search query data. This is a great way to manipulate the data and extract more precise variations.
C. Plus Sign – Good Way To Research Topics
Searching with a plus sign and two keywords shows query volume for one or other keyword. As such, this way of searching provides the broadest keyword query amounts and represents an excellent way to research a topic. With a plus sign you can add in all the related phrases for a topic and then see all of them lumped together.
2. Segment By Language
…if you’re interested in a specific language, you might want to look only for that language. They use the example of identifying how many searches for cat are done in Japanese in the United States, which allows you to segment searches with greater granularity.
You can also combine two languages using the plus sign search operator to see the combined query volume.
They said:
“For example, if you enter the Japanese character for cat… You might miss the overall trends, since many people in the US, for example, search for cat in English.
To get the full picture. Compare searches for the Japanese character for Cat and English searches for cat using the plus operator.”
3. Use Filters To Identify More Actionable Data
Daniel Waisberg said that comparing keywords helps identify more meaningful trends. In order to do
He said:
“Getting the data you need is essential, but to understand what it means, you need a comparison point. For example, is the growth localized or global? Is the growth seasonal, and if so, how does this season compare to the previous one?
To create a meaningful comparison, you can use the filter capability inside the search term.”
The following screenshot shows where a three dot menu in a drop down to access the filters.
4. Seasonality Discovery
He next showed how to use the filters to discover seasonality.
He explained:
“First enter the term in the trends explore section and change the time frame to five years.
This will create an interesting chart showing that this term is highly seasonal. People search for boat trips significantly more in the UK summer than in the winter. “
5. How To Remove Seasonality Trends
Next he explained how to use the built-in filters to analyze year over year trends.
This is again accessed through the filters that are somewhat hidden in the Google Trends interface.
He showed how to do it:
“While it is interesting to know the time of the year when the term has a higher interest, you’ll need more information if you want to make decisions based on the data.
You can use a special filter to analyze trends year over year. This will help you neutralize the seasonality effect, making sure you’re comparing like for like.
Start by changing the date to past 12 months.
Add an identical term to the compare box and hover over the box.
Click the three dots menu and select Change Filters.
Here you see two options, location and time range. Click the time range and select the custom time range to choose the previous time period.
If you’re looking for full years, you can use the built in capability to choose the past five years. That would make your search quicker.
After these steps, you’ll end up with two lines in your chart, one for the past 12 months and a second for the previous 12 months.”
This comparison can be done with up to five searches, which has the effect of being able to see the general trends in comparison, without the noise introduced by seasonality.
6. Compare Interest By Countries
The comparison by country allows users to compare search query volumes by country, two or more countries together.
The way to do that is with the filters that are accessed by the three-dot menu located next to the search query being researched.
Screenshot Of Country Filter
7. Save Or Share Trend Results
Ori explained that there are three ways to save or share Google Trends results.
- URL
- Embedded
- Export to spreadsheet
Share By URL
Sharing by URL is easy. Just copy the URL from the browser then share it.
Embed Trend Data
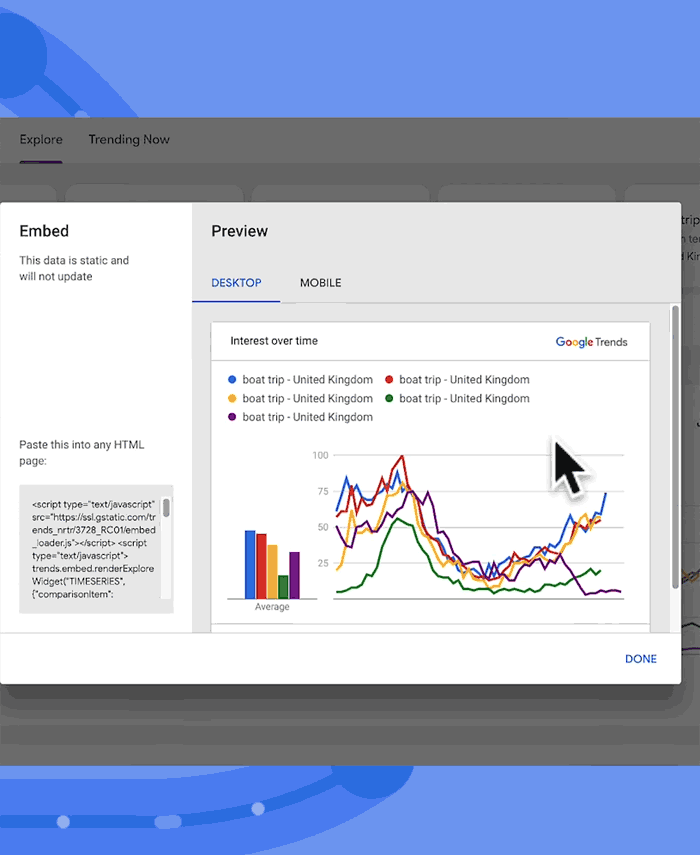
Embedding is a way to generate an embeddable card with the data that can be inserted into a web page, with bonus that the data is constantly updated.
“Another way to share a chart is to embed it on your website. You can generate an embeddable card to add to your website from almost any card on the page.”
Screenshot Of Embed User Interface

These cards will show up to date data and may also reproduce some in-product interactions.
Export The Data
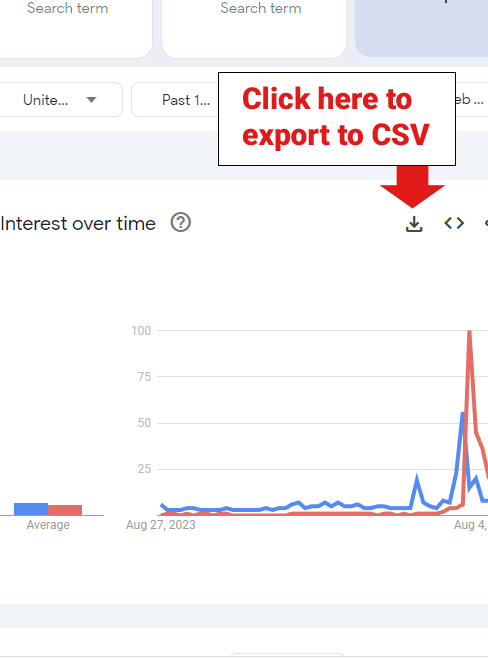
Clicking the export icon will provide the Google Trends data in the CSV format.
Screenshot Of Download Icon

Use Google Trends For Research
Google Trends is an excellent source of keyword and topic research and it’s completely free. Using these advanced methods will help get even more actionable data.
See also: Google Trends: How To Use It For SEO & Content Marketing
Watch The Google Trends Video Tutorial
Google Trends Advanced Tips

