vzphotos
Alphabet, Inc. (NASDAQ:GOOG) shares are seeing a massive spike higher, as the tech giant’s first-quarter earnings release showed better-than-expected results in both revenue and earnings. On the revenue side of the equation, Alphabet saw strong annualized growth rates of 15% (which is the best quarterly performance that the company has reported since the beginning of 2022). But while these figures are highly impressive, it can be argued that the best part of the story came from reports that Alphabet will be offering a dividend for the first time – and that the company will be participating in massive share buybacks of $70 billion.
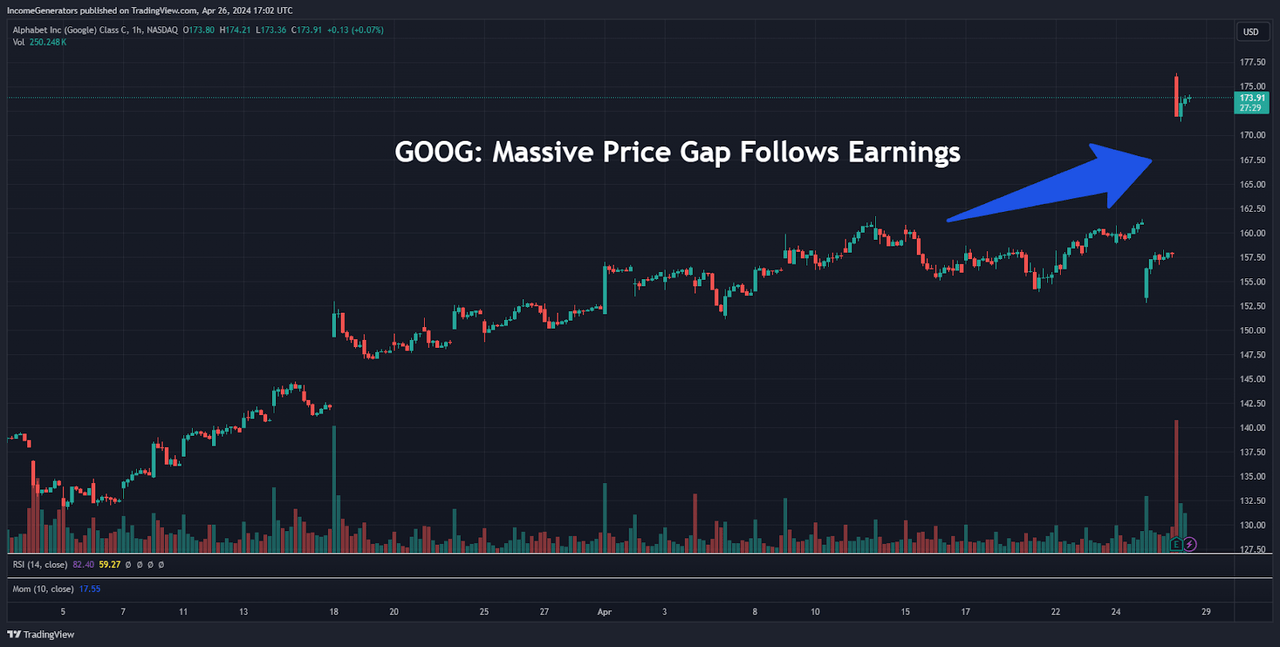
Massive Price Gap Follows Earnings (Income Generator via TradingView)
Not surprisingly, this information received a response from tech investors that was highly favorable – and GOOG share prices posted a massively bullish price gap after the earnings report was released. These surging stock moves ultimately raised Alphabet’s market value by roughly $300 billion before the upside pressure started to slow.
However, the real question here is whether or not these surging bullish moves will be sustainable because it can be very easy for stock investors to simply buy into a news release (at somewhat unattractive prices) when it might be a much better idea to simply exercise patience and wait for better opportunities after the dust settles. Next, we will look at some of the most critical price zones that stock traders should be watching before looking to establish new positions in shares of GOOG stock.
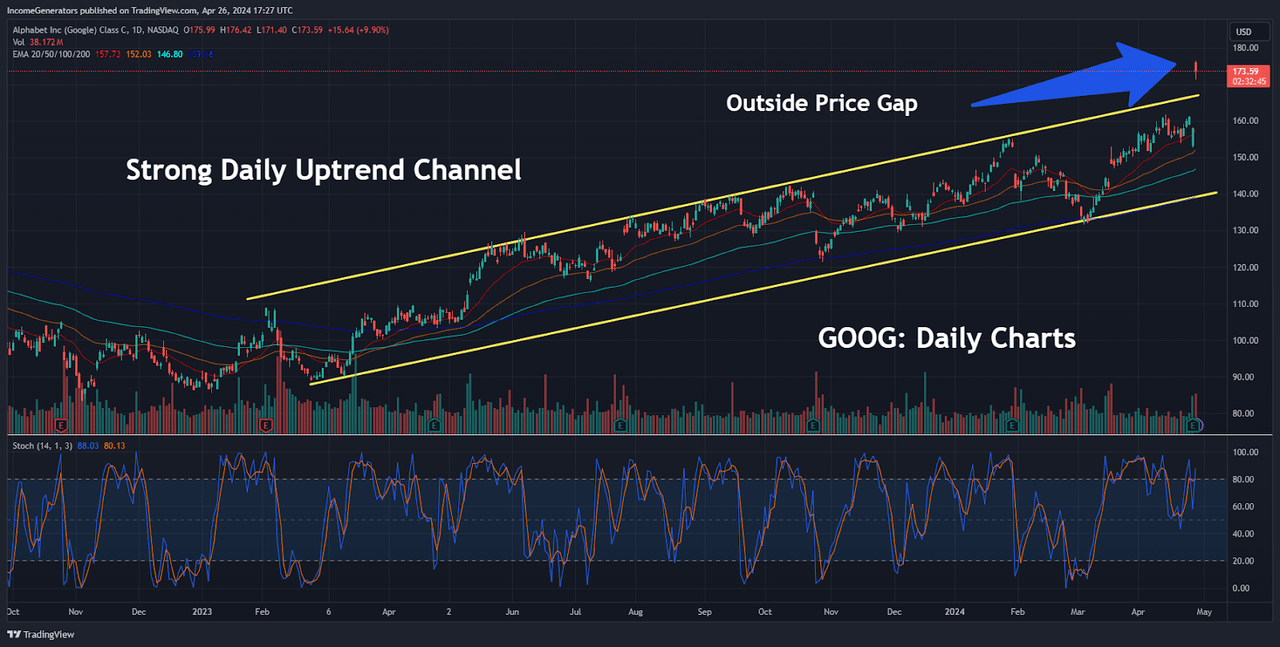
GOOG Daily Charts (Income Generator via TradingView)
On the daily charts, we can see that shares of GOOG stock have developed a very strong and stable uptrend channel formation that has essentially been in place since February 2023. Since this is a long-term formation that has been tested on several different occasions, we can lend a fair amount of validity to this structure in defining the stock’s broader uptrend.
With this in mind, it is important to note that the market’s initial reaction to Alphabet’s positive earnings report actually caused share prices to move outside this price channel (by quite a large distance). Unfortunately, this is a significant deviation from the mean, and it could signal a potential retracement lower now that traders have had ample time to react to this new information.
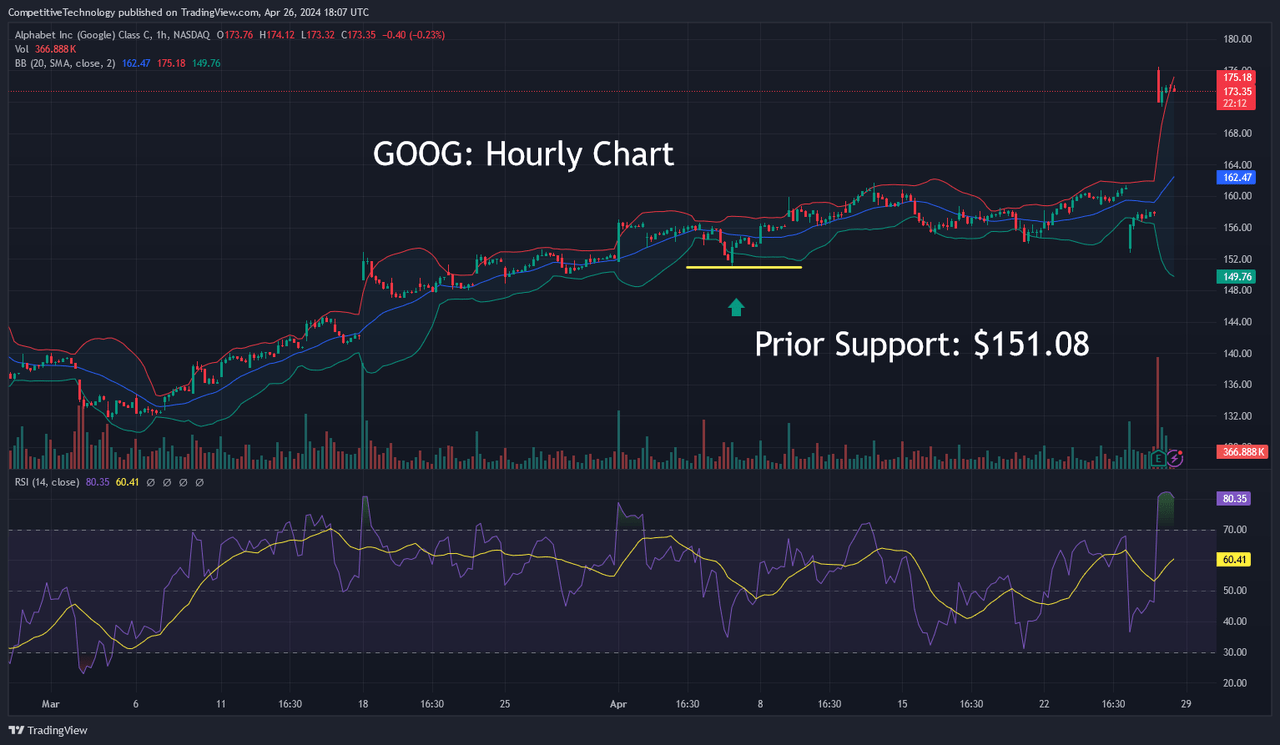
GOOG Hourly Charts (Income Generator via TradingView)
If this does occur, the first price level of importance comes in at $161.70, which is the stock’s prior high from April 12th and this level also marks the upper boundary of the long-term price channel. In many cases, uptrend channel lines will often work as support levels due to the fact that broken resistance levels turn into support zones – and this suggests that post-earnings downside could be contained by bullish buyers in this area.
Failures at $161.70, however, would then target the prior historical lows at $151.08 (which marked the near-term bottom from April 5th). As a result, we think that both of these price zones mark attractive areas to build long positions in GOOG.
So, while some investors might currently be experiencing a “fear of missing out” (or FOMO, as many say) it is important to exercise patience here because there are several reasons to believe that prices might start to stabilize (and drift lower) during the post-earnings period.
One important indicator that should be watched here is the reading in the Relative Strength Index (RSI), which is currently holding in severely overbought territory on the hourly charts. Of course, it is possible that bullish traders will continue buying at these upper levels and give the stock enough time for these indicator readings to roll over – but this is one factor that should be watched carefully as an indicator of sentiment in GOOG share prices.
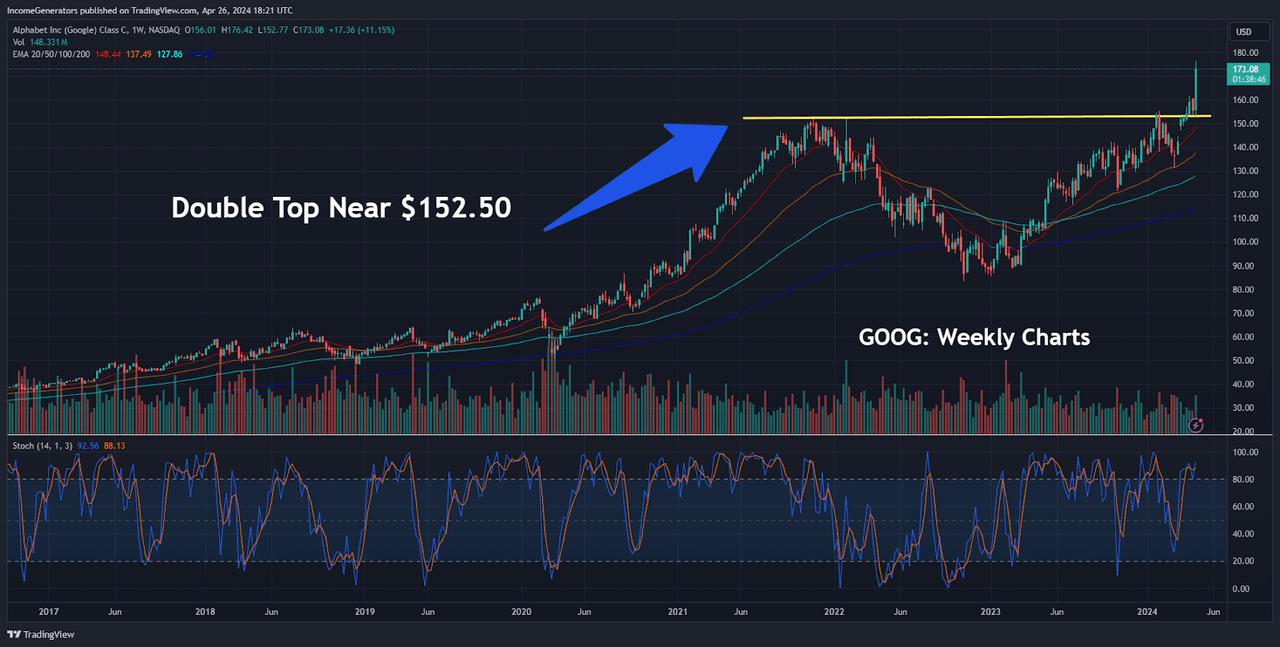
GOOG Weekly Charts (Income Generator via TradingView)
Perhaps the most interesting chart study for those trading GOOG share prices can be found on the weekly time frame for the stock. Specifically, this chart reading shows us that the price zone just above $150 is actually quite important for GOOG investors with longer-term time frames. On two separate occasions, GOOG shares ran into strong resistance in this area (during November of 2021 and again in January of 2024).
As we can see here, the initial price rejection from this area was actually quite forceful. After attempting to overcome this key psychological level, GOOG share prices experienced a significant downturn and actually saw long-term price lows of $83.45 (October 2022) before bullish buying activity became strong enough to prevent further downside. From these lows, bullish GOOG traders did not see this important $150 level again until January 2024, so it is clear that there was a significant amount of selling pressure that has been present in this area in the past.
Ultimately, this is the price zone that eventually worked at the stock’s breakout point, so it would seem that it would be a significant mistake to ignore the importance of this price zone in terms of long-term trend direction. Again, if we remember that resistance levels turn into support once those levels are breached, this can lend additional credence to the argument that GOOG shares can be viewed as an attractive “buy” if opportunities at this price zone become available again going forward.
On the negative side, readings in the weekly Stochastics indicator are currently printing in overbought territory and they are rolling over from these elevated levels. On balance, this is an indication that the stock has seen a strong price surge that might not be completely sustainable near-term. If these factors cause stock prices to move lower before the end of this month, bullish GOOG traders might have a better entry point at which to establish long positions (or to build upon prior long positions) and to capitalize on the encouraging news that was released with Alphabet’s most recent earnings report.

