Smile
Like everything else in economics, the business of owning and leasing shopping center space is ultimately dictated by supply & demand.
If there is more supply in a given market than demand, it will, of course, benefit the supply side, and the opposite holds true the other way around.
Anytime you can spot a supply/demand imbalance, especially if the factors being considered are long-term, structural trends, it may present a good investment opportunity.
It’s tricky, of course, because by the time you spot the trend, everyone else has too, generally speaking.
A recent example is the migration of U.S. residents to the sunbelt region of the country during the pandemic. During and directly after the pandemic, apartments in the Sunbelt were all the rage and developers couldn’t stop building. Migration to the Sunbelt is nothing new, but the pandemic seemed to accelerate the trend, likely due to friendlier regulations / fewer restrictions in the South (and of course politics).
But of course, as it always happens, developers continue to build until supply meets demand and once that happens, landlords lose their pricing power. As pricing power is diminished and operational growth is slowed, returns are diminished and less enticing for developers to build.
So, by the very nature of the real estate cycle, supply & demand imbalances are corrected by the open market, as it should be.
Sunbelt Demand
It’s no secret that there has been heavy demand to live and work in the sunbelt, and that the region has experienced significant population growth since the mid-20th century.
Several factors have influenced the migration from the north to the south, including the decline in the manufacturing sector, higher cost of living, higher taxes / more regulations, and of course nicer weather.
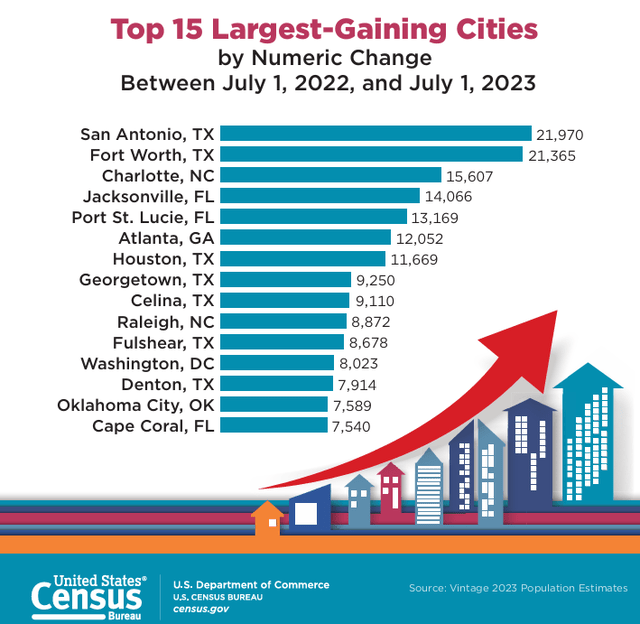
According to the U.S. Census Bureau, the top 15 largest-gaining cities by numeric change are practically all located in the sunbelt. This is just a snapshot of the period between July 2022 and July 2023, but I think it makes the point.
Covid’s Impact on Retail
In my opinion, it is too soon to know the full impact of the pandemic.
However, there are a couple of things that businesses have learned from the experience.
For one, the pandemic pulled forward the adoption of online retail. It was already happening, but the pandemic forced many people to change their shopping habits, and much of that has stuck.
Physical retail has had an overhang of sorts ever since online retail took off around 2010 or so. No one was quite sure how far the technology would go, how consumer behaviors would change, or how businesses would adapt.
One thing I think the pandemic did is to help businesses realize the value of their brick-and-mortar stores.
The question before the pandemic was to what extent e-commerce would replace brick-and-mortar. Is online better? Is a physical store better?
As it turns out, the answer is both. An omni-channel system has been the superior model to just an online or brick-and-mortar setup.
Sometimes a consumer wants to browse through a store, sometimes they want to stay home, and have it delivered, and sometimes they want to order online and pickup without getting out of the car. Businesses need to meet the consumer where they are at.
What business learned is that they need all options available in order to stay competitive. Not just online, and not just brick-and-mortar.
So, what may have taken another decade to fully realize, I think, was pulled forward by the pandemic.
I think businesses are fully aware that they still need brick-and-mortar, no matter how much technology changes. I think as a consequence, much of the overhang created by online retail has been removed.
Shopping Center Supply
So with apartments, the influx of new residents to the sunbelt created a rush to build which put the supply / demand closer to equilibrium and removed the landlord’s advantage. I’m long Mid-America (MAA) and Camden Property (CPT).
However, all those new residents need to eat, get their hair cut, buy shoes, etc.
So more people, more demand, how is the shopping center supply?
Well, shopping center supply really hasn’t kept up with the growing demand, especially in high-growth sunbelt markets.
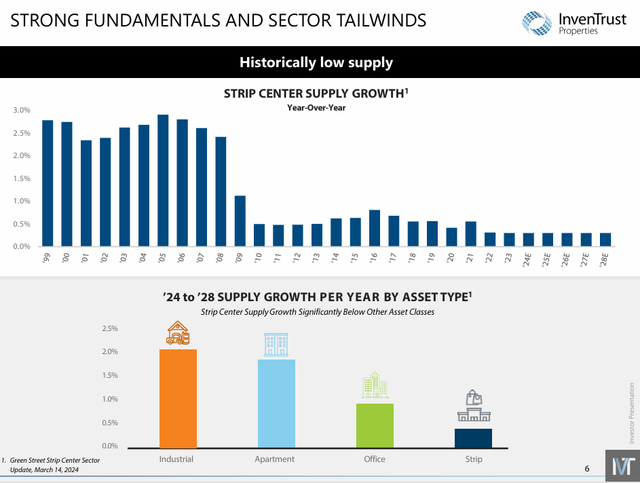
The graphic below is from InvenTrust’s 2Q presentation. Since the Great Recession in 07-09, shopping center supply has never recovered and that trend is not expected to reverse anytime soon.
As shown below, strip center supply growth expected from 2024 to 2028 is well below that of industrial, apartment, and even office.
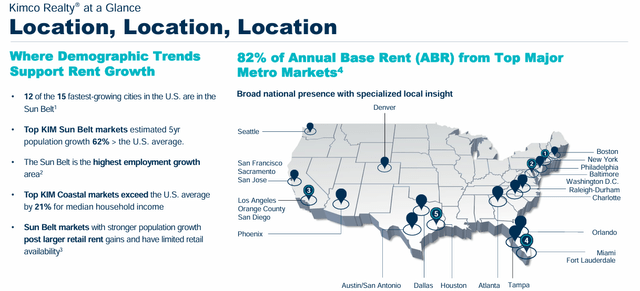
According to the Kimco (KIM) graphic below, 12 out of the 15 fastest growing cities are in the sunbelt, and the sunbelt is the highest employment growth area. I think the last bullet point sums it up:
- “Sun Belt markets with stronger population growth post larger retail rent gains and have limited retail availability.”
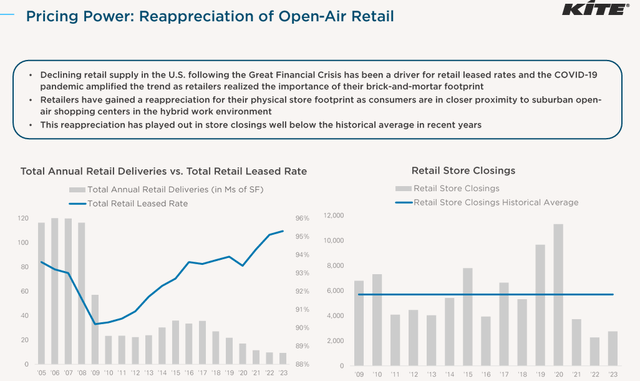
The graphic below from Kite Realty shows annual retail deliveries compared to retail leased rates. It’s pretty apparent that supply hit a brick wall in 2009-2010 and that retail leased rates continued to climb.
The next chart shows how retail store closures are well below the historical average.
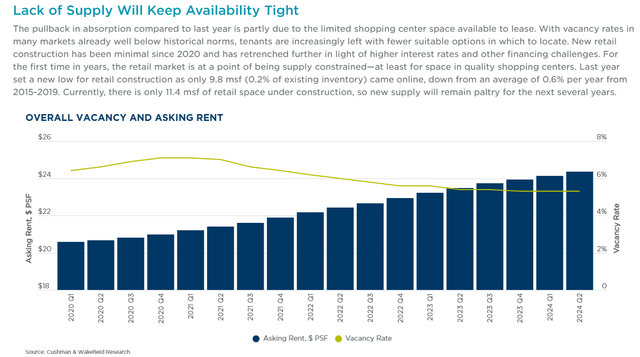
According to Cushman & Wakefield, retail vacancy rates are below the historical norms, new retail construction has been minimal over the past several years, and retail is becoming supply-constrained for the first time in years.
With less supply and increasing demand the natural outcome is increased pricing per square foot (“PSF”) and reduced vacancy rates. All good things for shopping center owners.
Given the favorable supply & demand backdrop, I wanted to suggest a couple of names that I think will benefit the most from the entrenched structural trend. All 4 companies are shopping center REITs and all 4 have a heavy sunbelt presence.
Kimco Realty (KIM)
KIM has a market cap of approximately $14.8 billion and a 101 million SF portfolio comprising 567 shopping centers and mixed-use assets. The company specializes in grocery-anchored shopping centers that are strategically located in first-ring suburbs of major markets with a particular focus on coastal and sunbelt markets.
The company looks for tenants that provide necessity-based goods and services, as well as retailers that drive multiple shopping trips each week. KIM’s top tenant is TJX which makes up 3.8% of the company’s annualized base rent (“ABR”), followed by Home Depot which makes up 1.8% and ROSS which makes up 1.8%. No tenant makes up more than 4% of KIM’s annual rent.
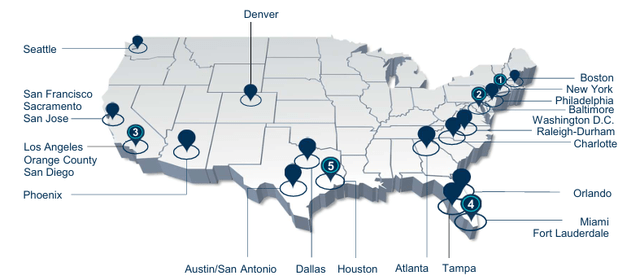
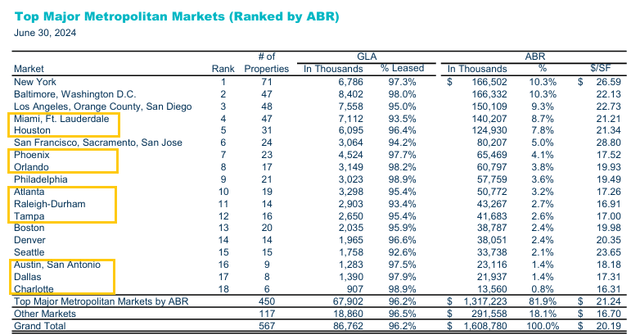
Kimco’s top 3 markets are New York, Baltimore – Washington D.C., and Los Angeles, which combined makes up nearly 30% of its ABR.
Below is a list of Kimco’s markets ranked by ABR. I highlighted each sunbelt market, which by ABR, represent almost 40% of the company’s portfolio.
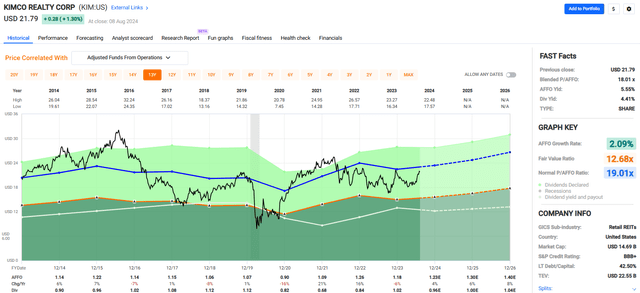
Since 2014, the company has had an average AFFO growth rate of 2.09%. Analysts expect growth to accelerate over the next several years, with AFFO projected to increase by 4% in 2024, and then increase by 6% and 8% in the next two years.
The company has an investment-grade balance sheet with a BBB+ credit rating and pays a dividend yield of 4.41%. The dividend is well-covered with a 2023 AFFO payout ratio of 86.44% and the stock is trading at a discount to its historical average.
KIM is currently trading at a P/AFFO of 18.01x, compared to its average AFFO multiple of 19.01x.
We rate Kimco Realty a Buy.
Kite Realty Group Trust (KRG)
KRG has a market cap of approximately $5.4 billion and a 28 million SF portfolio made up of 178 shopping centers and mixed-use assets.
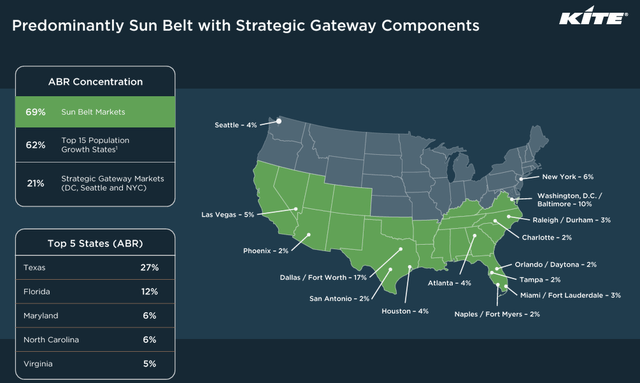
The company specializes in the development, acquisition, and operation of shopping centers that are primarily grocery-anchored and located in the sunbelt. Kite Realty has a strong focus on the sunbelt region and derives 69% of its ABR from its sunbelt markets.
Additionally, 79% of the company’s ABR is derived from shopping centers that have a grocery component and 94.8% of its retail portfolio is leased.
The company’s top tenant is TJX, which makes up 2.8% of its ABR, followed by Best Buy and ROSS Stores, which make up 2.0% each. In total, KRG’s top 15 tenants only make up 21.0% of its ABR.
By industry, the company focuses on a mix essential retail and experiential. Some of its largest industries include grocery, office supply, banks, pet stores, medical, discount retailers, and restaurants.
As you can see from the graphic below, KRG has a large focus on sunbelt markets. Texas and Florida are its top 2 states and alone they make up nearly 40% of the company’s ABR. The company’s top market is Dallas / Fort Worth which makes up roughly 17% of its ABR.
Kite Realty has an investment grade balance sheet with a BBB credit rating and excellent debt metrics including a net debt to adjusted EBITDA of 4.8x and a debt service coverage ratio of 4.9x.
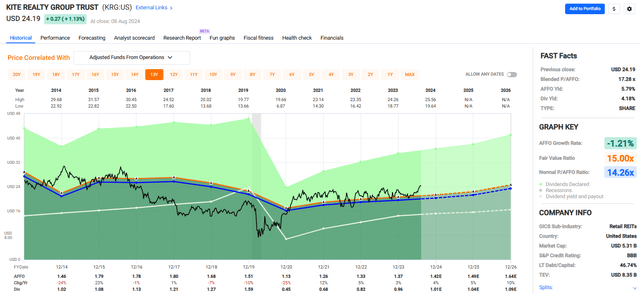
Analysts expect the company to grow its AFFO per share by 4% in 2024, by 5% in 2025, and then by 10% in 2026.
The company pays a solid dividend yield of 4.18% and its dividend is well covered with an AFFO payout ratio of 70.07%.
Currently, the stock trades at a P/AFFO of 17.28x, compared to its average AFFO multiple of 14.26x. While it is priced above its historical multiple, we feel that forward growth justifies a higher multiple and rate Kite Realty Group a Strong Buy.
Whitestone REIT (WSR)
WSR has a market cap of approximately $664.9 million and a 5.1 million SF portfolio comprising 57 community centered shopping centers that are 93.5% occupied.
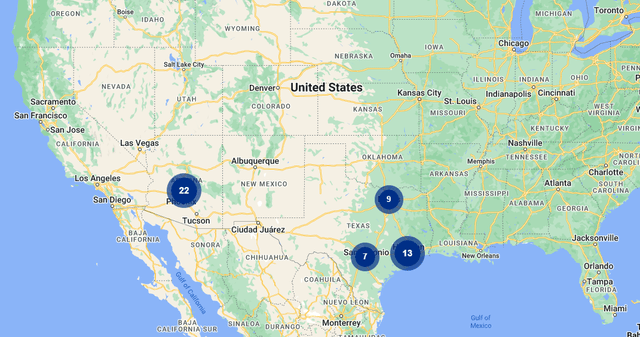
All of the company’s properties are located in Texas and Arizona. WSR looks for high-growth markets, primarily in and around Dallas-Fort Worth, Austin, San Antonio, Houston, and Phoenix. At the end of 2023 the company owned:
- 13 properties in Houston
- 9 properties in Dallas-Fort Worth
- 3 properties in San Antonio
- 6 properties in Austin, and
- 26 properties in the Scottsdale-Phoenix, metro.
Whitestone targets retailers that are service-orientated. Some of its largest industries include restaurants, salons, grocery, medical, and financial services. At the end of 2Q-24 the company had a diverse tenant base of nearly 1,500 and its largest tenant only accounted for 2.1% of the company’s ABR.
With a debt to pro forma EBITDAre of 8.0x and an EBITDA to interest expense ratio of 2.34x I’d like to see the company reduce its debt. I typically like a leverage ratio under 7x and a coverage ratio above 3x.
While the balance sheet can be improved upon, there’s no question that WSR has some of the highest quality properties located in some of the best markets in the sunbelt. During the second quarter, the company’s leasing spreads on a GAAP / straight line basis averaged 33.3% for new leases and 13.9% for renewals.
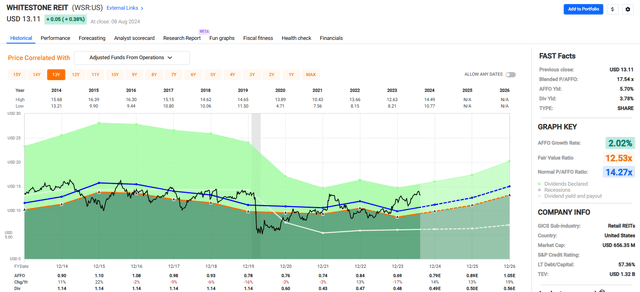
The demand for WSR properties is reflected in its earnings projections, with analysts expecting AFFO per share to increase by:
- +14% in 2024
- +13% in 2025
- +19% in 2026
WSR pays a 3.78% dividend yield that is well covered with an AFFO payout ratio of 69.57%. Currently, the stock is trading at a P/AFFO of 17.54x, compared to its normal AFFO multiple of 14.27x.
We really like WSR’s properties and the markets they are located in. However, given its past operational history, along with high leverage and an AFFO multiple several turns above its average, we rate Whitestone REIT a Hold.
InvenTrust Properties (IVT)
IVT has a market cap of approximately $1.9 billion and a 10.5 million SF portfolio comprising 64 retail properties that are 87% grocery-anchored and 96.4% leased.
Inland American Real Estate, as it was previously named, was formed in 2004. The company changed its name in 2015 to InvenTrust Properties and filed its IPO in October 2021.
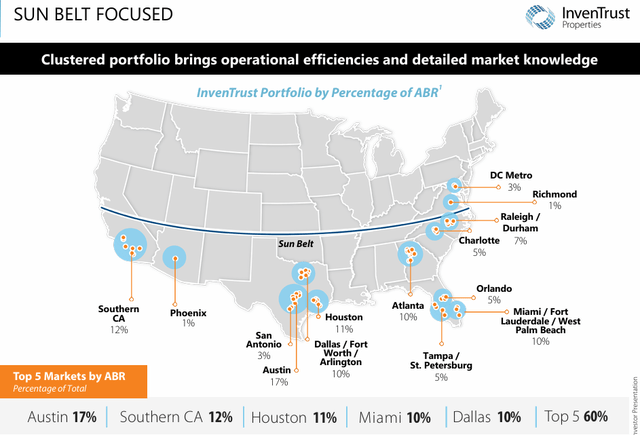
InvenTrust specializes in the redevelopment, acquisition, and operation of multi-tenant retail properties that are grocery-anchored and necessity-based. The company has a strong focus on the sunbelt and derives 95% of its net operating income (“NOI”) from its sunbelt markets.
The company’s largest tenant is Kroger which makes up 5.1% of its ABR, followed by Publix and TJX which make up 3.3% and 2.6%, respectively. Other well-known tenants include Whole Foods, Albertsons, Pet Smart, Costco, Dick’s, and Trader Joe’s.
InvenTrust’s largest 5 markets based on ABR is Austin at 17%, Southern California at 12%, Houston at 11%, Miami at 10%, and Dallas at 10%. In total, only 2 of its markets are outside of the sunbelt and only make up 4-5% of the company’s ABR.
InvenTrust has a credit rating of BBB- (stable) from Fitch and strong debt metrics including a net debt to adjusted EBITDA of 5.1x and a fixed charge coverage ratio of 4.3x.
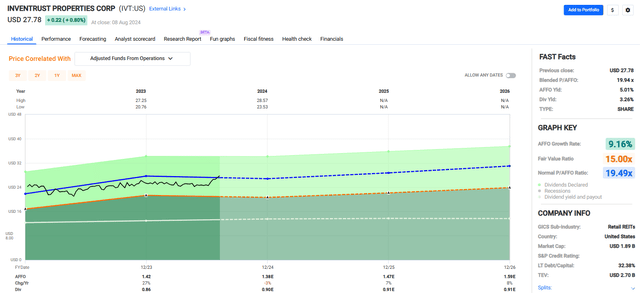
In the company’s short public history, it has had an average AFFO growth rate of 9.16%. Analysts expect AFFO per share to fall by -3% in 2024, but then to increase by +7% in 2025 and then increase by +8% the following year.
IVT pays a 3.26% dividend yield that is secure with an AFFO payout ratio of 60.70%. Currently the stock is trading at a P/AFFO of 19.94x, compared to its average AFFO multiple of 19.49x.
The company is relatively new, at least as a publicly traded company, but its balance sheet is in good shape, its dividend has more than enough coverage, and its properties are well positioned to take advantage of the lagging shopping center supply.
We rate InvenTrust Properties a Buy.
In Closing
So, who is backing up the cart with Sunbelt Shopping Center REITs?
We think it makes sense to have shopping center exposure within a diversified REIT portfolio. Specifically, we like the Sunbelt markets because of the attractive demographic trends we see unfolding.
As always, thank you for reading and commenting.
Author’s Note: Brad Thomas is a Wall Street writer, which means he’s not always right with his predictions or recommendations. Since that also applies to his grammar, please excuse any typos you may find. Also, this article is free: written and distributed to assist in research while providing a forum for second-level thinking.

