Bogdanhoda
Synopsis
Arcosa (NYSE:ACA) is an established provider of infrastructure-related products and solutions to the North American construction, transportation, and engineered structures markets. ACA’s historical financials have shown consistent consolidated revenue growth. In addition, its profitability margins have been expanding annually. For its most recent 1Q24, it continues to report top-line growth, with revenue increasing by 9% year-over-year.
Currently, ACA is actively shifting its portfolio of businesses away from cyclical ones and focusing on those that are less cyclical. This strategic initiative is expected to make the business more resilient to economic shocks. Infrastructure spending is robust and has been increasing. Additionally, electric utility CAPEX has been consistently increasing and is forecast to continue growing. These positive trends are expected to bolster ACA’s growth outlook. On these notes, I am recommending a buy rating for ACA.
Historical Financial Analysis
Author’s Chart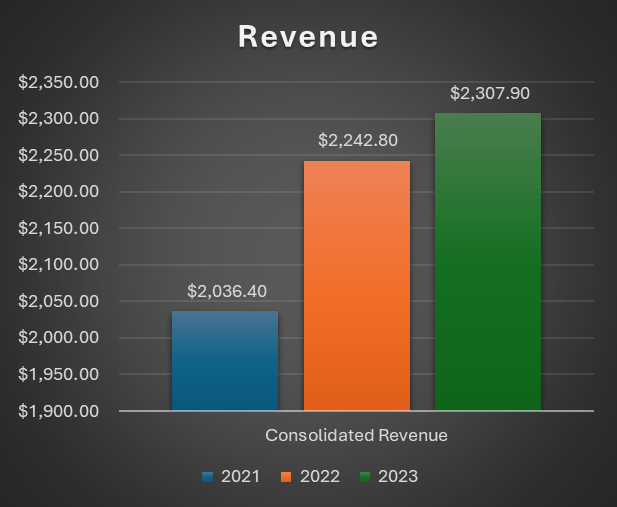
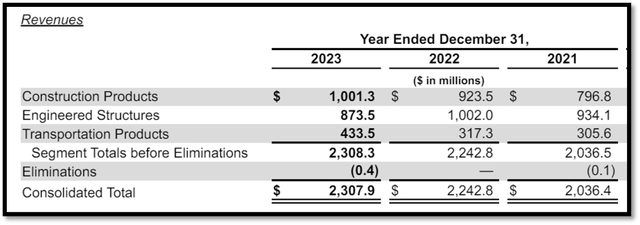
Over the last three years, ACA’s consolidated revenue has been consistently growing. In 2022, it reported consolidated revenue of $2.242 billion compared to 2021’s $2.036 billion. This growth was driven by growth in all three of its reportable segments, which are construction products, engineered structures, and transportation products. The growth rate was 15.9%, 7.3%, and 3.8%, respectively. The strong growth seen in construction products is driven by increased pricing across ACA’s product lines, such as aggregate and specialty materials. Additionally, higher volumes from newly acquired businesses also contributed to the growth.
In 2023, consolidated revenue grew to $2.307 billion, which represents a year-over-year growth rate of 2.9%. If I take out the impact of ACA’s storage tanks divestiture, revenue growth was 12.4%. The construction products segment increased 8.4%, driven by increased pricing. Its engineering structures segment increased by 7.4% if the impact of the storage tanks divestiture was taken out. Lastly, its transportation products segment increased by 36.6%, mainly because of higher volumes in steel components and inland barge.
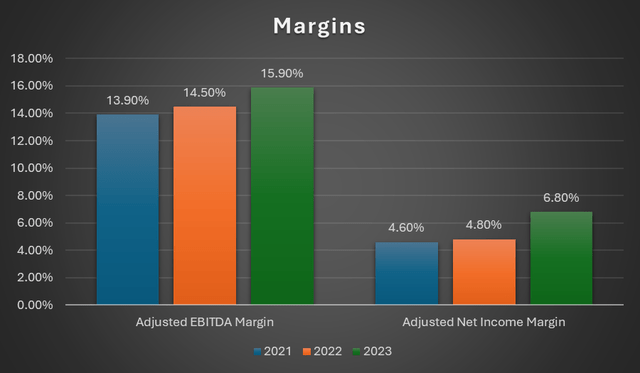
Moving onto profitability margins, both adjusted EBITDA margin and adjusted net income margin have been expanding annually. In 2023, ACA’s adjusted EBITDA margin expanded from 14.50% to 15.90%. For 2023, ACA’s adjusted EBITDA margin expansion is mainly due to the adjusted EBITDA calculation for 2022 excluded a $189 million gain on the sale of the storage tanks business. In addition, in 2023, both the cost of revenue and selling, general, and administrative [SG&A] expenses contracted modestly, which further boosted ACA’s net income and benefited its adjusted EBITDA. Lastly, its adjusted net income margin expanded from 4.8% to 6.8%.
First Quarter 2024 Earnings Analysis
ACA released its most recent 1Q24 results on May 2, 2024. For the quarter, revenue increased 9% year-over-year, and it was driven by all three reportable segments. Construction products segment revenue increased 6.4%, engineered structures segment revenue increased 11.5%, and transportation products segment revenue increased 9.9%, respectively.
For the construction products segment, the increase was driven by contributions from recent acquisitions and higher pricing across its specialty material and aggregates businesses. The main factor driving the growth in engineered structures segment revenues was the volume growth in ACA’s utility and wind tower businesses, which was partially offset by lower utility structure pricing because of the product mix. Lastly, higher volumes and hopper barge prices were the main drivers of the increase in transportation products segment revenues.
Author’s Chart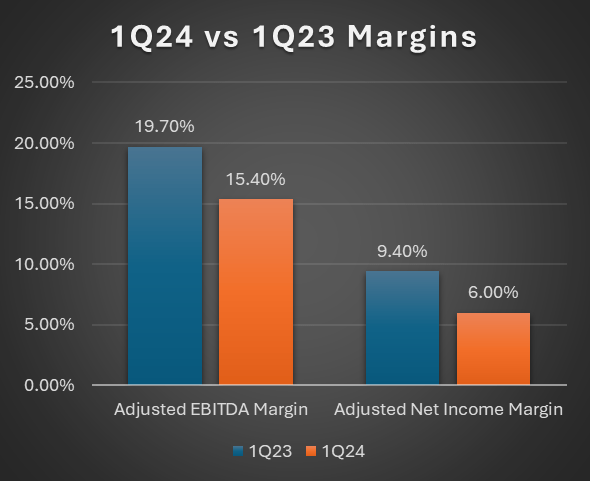
Based on reported figures, for the quarter, adjusted EBITDA margin contracted from 19.70% to 15.40%. Its adjusted net income margin contracted from 9.40% to 6%. Although its profitability margins showed contraction, it was mainly due to the previous period, 1Q23, which included a gain on the sale of depleted land of $21.8 million. Therefore, it impacted year-over-year comparability. Therefore, it is important to take note of this before taking in the face value of these figures. Instead, it will create a better comparison if I look at its normalised figures instead.
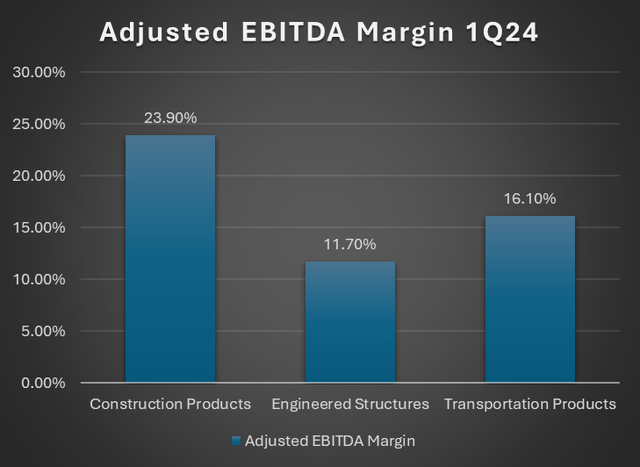
If normalised for the $21.8 million gain on the sale of depleted land, consolidated adjusted EBITDA grew approximately 7% year-over-year. For its construction products segment, excluding the land sale gain, the adjusted segment EBITDA margin expanded from 23.1% to 23.9% year-over-year. For the engineered structures products segment, adjusted segment EBITDA margin fell 2.8% to 11.7%. This decrease was caused by lower margin in its utility structures business as a result of a shift in product mix. Lastly, its transportation products’ adjusted segment EBITDA grew 32% year-over-year to $18.6 million. This implies that its adjusted segment EBITDA margin expanded from 13.4% to 16.1%. This expansion was driven by higher barge volumes and improved margins.
Business Overview
ACA is an established provider of infrastructure-related products and solutions to the North American construction, transportation, and engineered structures markets. To take advantage of the fragmented nature of the industries in which ACA operates, it strategically focuses on driving organic and disciplined acquisition growth.
Currently, there are a few key market trends going on, such as the expansion of transmission, distribution, and telecommunications infrastructure, the replacement and growth of ageing transportation infrastructure, and the ongoing shift to renewable power generation. Given its experience, expertise, and business model, it is well positioned to capitalise on these key market trends.
ACA’s business is segmented into construction products, engineered structures, and transportation products. Under construction products segment, ACA produces and sells natural aggregates, recycled aggregates, specialty materials, and construction site support equipment. For engineered structures, it produces and sells steel structures for infrastructure businesses. Lastly, for transportation products, it produces and markets inland barges, marine hardware, fibreglass barge covers, etc. for railcars and other industrial and transportation equipment.
Investment in Construction Products Segment
According to ACA, its barges, wind towers, and steel components operate in cyclical industries. Barges and steel components are parked under transportation products, while wind towers are under engineered structures. In contrast, its construction products segment is less cyclical. During the earnings call, Antonio Carrillo, the President and Chief Executive Officer of ACA, also emphasised that wind towers and inland barges are considered cyclical businesses.
Investor Relations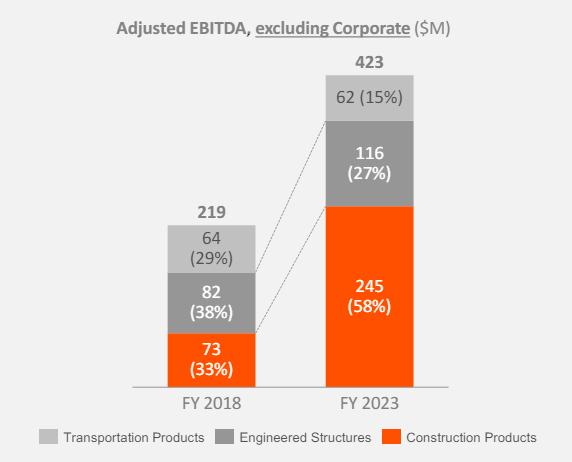
From 2018 to 2023, ACA has successfully increased its construction products segment’s adjusted EBITDA weightage to 58% from 33%. The engineered structure’s adjusted EBITDA weightage has been reduced from 38% to 27%, while the transportation product segment has been reduced from 29% to 15%. This shift has transformed ACA into a less cyclical business, making it more resilient to economic shocks.
Based on the following 1Q24 adjusted EBITDA margin chart, it is clear that ACA’s construction products segment has the highest adjusted EBITDA margin of 23.90%, followed by transportation products segment of 16.10%, and engineered structures segment of 11.70%. Based on these statistics, ACA made an excellent move by shifting its business more towards the higher-margin, less-cyclical construction products segment.
Divestiture of Storage Tank Business
In October 2022, ACA completed its planned divestiture of its storage tank business to Black Diamond Capital Management for $275 million in cash. Its storage tank business is reported under its engineered structures segment. Through this divestiture, it allows ACA to execute the following long-term strategies.
Firstly, the divestiture reduces the complexity and cyclicality of its current business portfolio composition. This divestiture is able to reduce cyclicality because it provides capital that ACA can deploy towards less cyclical businesses. Secondly, this divestiture provides ACA with the liquidity it needs for reinvestment into higher-margin, growth businesses. Therefore, it is killing two birds with one stone.
This divestiture shows management’s commitment and focus on maximising shareholder value, growing the business, and preparing it so that it is well positioned to capitalise on supportive market conditions. As previously mentioned, there are a few significant market trends that are currently in motion, including the growth and replacement of ageing transportation infrastructure, the expansion of transmission, distribution, and telecommunications infrastructure, and the transition to renewable power generation.
Positive Outlook for Arcosa
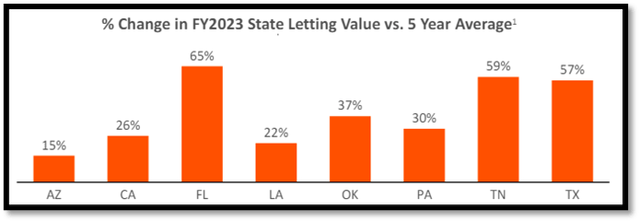
Based on the chart, the positive percentage change in FY2023 state letting value vs. the five-year average indicates that infrastructure spending is increasing. The driver behind the increasing infrastructure spending is increased funding arising from the Infrastructure Investment and Jobs Act [IIJA]. Therefore, the increasing infrastructure spending is expected to bolster ACA’s construction products segment.
In addition to the robust infrastructure spending, ACA’s construction products segment also reported strong pricing gains in 2023. In 2023, construction products segment revenue was up 8.4% year-over-year. This strong growth was driven mainly by increased pricing across its product lines, such as aggregate and specialty materials.
Looking ahead, the strong construction products pricing gain reported in 2023 is expected to continue into 2024, further supporting pricing for construction products for the quarters ahead. For 1Q24, construction products segment revenue increased 6.4% year-over-year. This growth was attributed to higher pricing across its aggregates and specialty material businesses, proving that the 2023 pricing momentum carried down into the quarter.
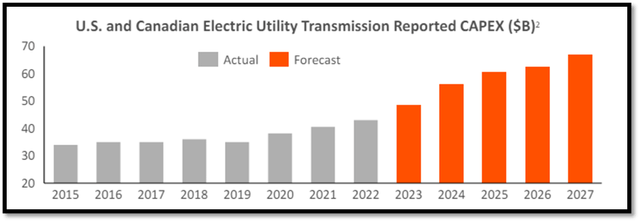
Moving onto the engineered structures segment, US and Canadian electric utility transmission capital expenditures are forecast to continue growing until 2027. From 2015 to 2022, electric utility transmission capital expenditures have been consistently increasing from mid-$30 billion to low-$40 billion.
According to the Wall Street Journal [WSJ], in the US, electricity produced from renewable sources is breaking records and is predicted to continue rising as wind and solar power generation overtake natural gas as the preferred alternatives to coal power generation. This shows that there is an increasing demand for more renewable energy capacity. Therefore, the forecasted increase in capital expenditures is driven by the need for more renewable energy capacity and increased federal funding for infrastructure.
Relative Valuation Model
Author’s Relative Valuation Model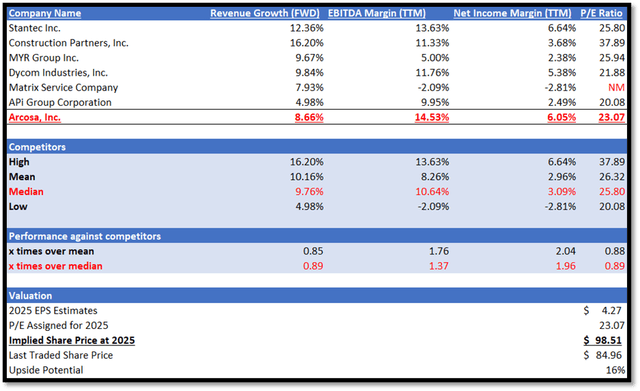
A brief background on ACA before I proceed. ACA is an established provider of infrastructure-related products and solutions to the North American construction, transportation, and engineered structures markets. According to Seeking Alpha, it operates in the construction and engineering industry.
In my relative valuation model, I will be comparing ACA against its peers on both growth outlook and profitability margin trailing twelve months [TTM]. When comparing the growth outlook, I will be using the forward revenue growth rate, as it is forward-looking. For profitability margins, I will be looking at both EBITDA margin TTM and net income margin TTM. EBITDA margin gives us a good measure of ACA’s core business activities’ performance, while net income margin shows us its overall profitability.
Although ACA underperformed its peers in terms of growth outlook, the underperformance is modest. ACA has a forward revenue growth rate of 8.66%, while its peers’ median is 9.76%. In terms of profitability margins, it paints another story as ACA outperforms its peers in both EBITDA margin TTM and net income margin TTM. ACA has a reported EBITDA margin TTM of 14.53% vs. its peers’ median of 10.64%. ACA’s net income margin TTM of 6.05% is also higher than peers’ median of 3.09%.
Currently, ACA has a forward P/E ratio of 23.07x, which is below its peers’ median of 25.80x. Although I do note that ACA outperforms in terms of profitability margins TTM, it underperforms in terms of growth outlook. With its weaker growth outlook, it is fair for ACA to be trading at a slight discount. Therefore, my 2025 target P/E is 23.07x, and this also ensures that my relative valuation model remains conservative.
For 2024, the market revenue estimate for ACA is $2.66 billion, while 2024 EPS is $3.61 per share. For 2025, the revenue estimate is $2.88 billion, while the 2025 EPS is $4.27 per share.
According to its most recent earnings call, management increased its FY2024 consolidated revenues guidance to be between $2.58 billion and $2.78 billion. For reference, the previous guidance range was $2.46 billion to $2.72 billion. In addition, management also raised its FY2024 consolidated adjusted EBITDA to be between $410 million and $440 million. Its previous guidance range was $380 million to $420 million. The increase in consolidated revenue guidance and consolidated adjusted EBITDA shows their confidence in the business as well as the business growth outlook and profitability.
Together, management’s guidance and my forward-looking analysis as discussed support the market’s estimation, thus justifying it. By applying my conservative 2025 target P/E to ACA’s 2025 EPS estimate, my 2025 target share price is $98.51.
Risk and Conclusion
The risks associated with ACA are delays in construction projects and failures in inventory management. Many of its products are used in large-scale projects. Due to the scale of such projects, they typically require a significant amount of planning and preparation. In addition, due to their size, these projects can be delayed or rescheduled for a variety of reasons. Examples are availability of labour, obtaining permits, issues adhering to regulations and/or environmental standards, financing issues, shutdowns or other work stoppages due to health concerns, and unexpected soil conditions. When these delays happen, they could result in unscheduled downtime, higher operating expenses and inefficiencies for ACA, and higher levels of excess inventory.
Additionally, ACA keeps an inventory of specific products that meet standard specifications, which will eventually be bought by its end users. In order to maintain adequate inventory levels of some products that it anticipates will be in high demand, ACA will perform forecasts on the demand for these products. Furthermore, the forecast is also done to minimise its inventory of other products for which it anticipates little interest. As with all forecasts, they are not always accurate. Therefore, any unanticipated shifts in consumer demand for these goods will result in higher-than-expected levels of excess inventory.
ACA’s last three years have shown consistent growth in its consolidated revenue. Apart from the robust top-line growth, its profitability margins have been expanding annually as well. For its most recent 1Q24 earnings results, it continues to report consolidated revenue growth, which increased 9% year-over-year.
Currently, ACA is actively shifting its business portfolio away from cyclical industries and towards less cyclical ones. The benefit of this strategic initiative is that it increases ACA’s resilience to economic shocks. Infrastructure spending is strong and has been rising. Furthermore, electric utility transmission CAPEX has been steadily increasing over the years, and this momentum is expected to continue until 2027. These positive catalysts are expected to bolster ACA’s outlook. Therefore, I am recommending a buy rating for ACA.


