
Google rolled out a new Core Web Vitals tool called CrUX Vis that shows you hidden patterns in performance scores and offers guidance on what to improve. The data is sourced from the CrUX dataset which is based on actual user experiences on the URLs and websites that are analyzed and explored in the new tool.
CrUX
The new tool is based on the CrUX dataset which is what the Core Web Vitals scores are based on.
Chrome’s documentation of CrUX explains:
“The Chrome User Experience Report (also known as the Chrome UX Report, or CrUX for short) is a dataset that reflects how real-world Chrome users experience popular destinations on the web.
CrUX is the official dataset of the Web Vitals program. All user-centric Core Web Vitals metrics are represented.
CrUX data is collected from real browsers around the world, based on certain browser options which determine user eligibility. A set of dimensions and metrics are collected which allow site owners to determine how users experience their sites.
The data collected by CrUX is available publicly through a number of Google tools and third-party tools and is used by Google Search to inform the page experience ranking factor.
Not all origins or pages are represented in the dataset. There are separate eligibility criteria for origins and pages, primarily that they must be publicly discoverable and there must be a large enough number of visitors in order to create a statistically significant dataset.”
Debugging Core Web Vitals
Improving website performance scores may not offer the direct ranking benefit that many SEOs and publishers hoped it would but it’s still the same critical factor to get right it’s always been. High performance scores improve earnings, ad clicks, conversions, user experience, website popularity and virtually every goal an SEO and publisher has for a site, including indirect benefits to rankings. A site can still limp along with poor performance scores but it will not be living up to its full earnings potential.
Although tools based on Chrome’s Lighthouse offer performance snapshots and estimated scores those tools were unable to provide a sense of how the site was performing over time or provide a breakout of important performance metrics to gauge whether performance is trending up or down.
CrUX Vis
Chrome’s new tool is called CrUX Vis, a data visualization tool that enables users to visualize the Chrome User Experience data (CrUX). CrUX Vis provides an entirely new way to understand website performance and gain a big picture view of what’s going on at the URL and website level (called origin).
The different variables for what is visualized can be changed in the section at the top of the page called Controls, covering data, device and period.
Screenshot Of CrUX Vis Controls
Segment Data By Multiple Variables
As seen in the screenshot above, the data can be segmented in three ways:
- Data
Performance scores can be viewed by origin (the entire site) or by URL - Device
Data can be segmented and visualized by mobile, data and a combined view. - Period (Date Range)
The tool currently allows data visualization by 25 overlapping time periods stretching back about six months. It currently shows performance visualizations from 3/17/2024 through 09/28/2024.
Five Views Of Metrics
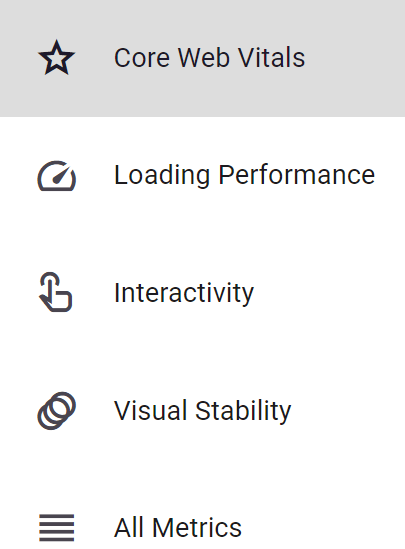
There are five ways to analyze the data, covering core web vitals, three categories of metrics and all metrics combined. These variables are accessible on left hand navigation panel on the desktop UI (user interface).
- Core Web Vitals
- Loading Performance
- Interactivity
- Visual Stability
- All Metrics Combined
Visualizing Data
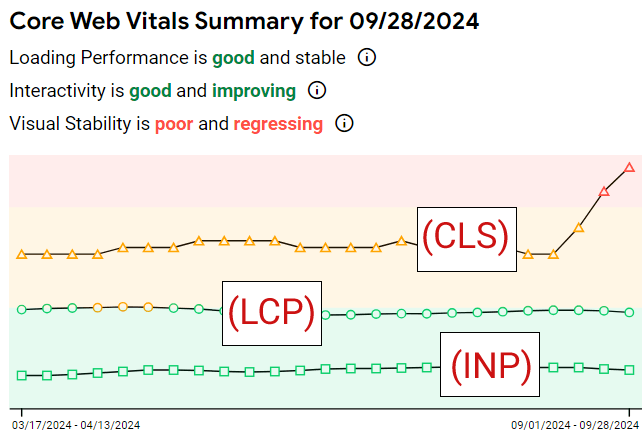
The visualization for Core Web Vitals shows a time-based trend graph that’s colored with green, yellow, and pink. Green is good and pink is not good.
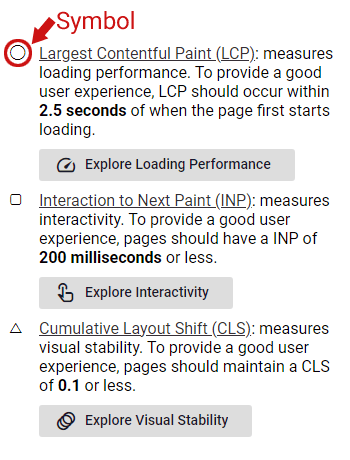
The three core web vitals are represented by a circle, squate and a triangle:
- Circle = Largest Contentful Paint (LCP):
- Square = Interaction to Next Paint (INP)
- Triangle = Cumulative Layout Shift (CLS)
The desktop UI (user interface) shows the trend graph and a summary on the left and a text explanation on the right.
Screenshot Of User Interface
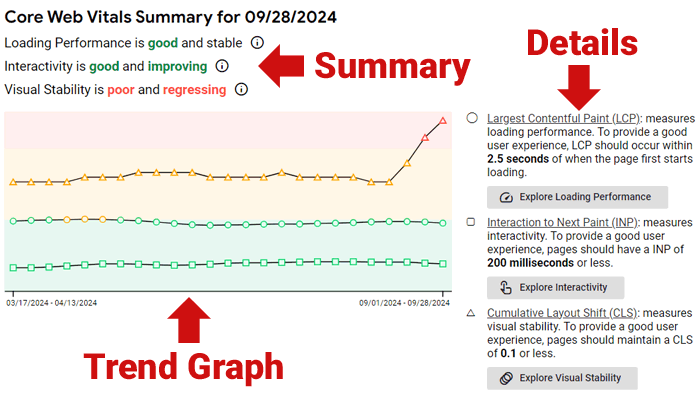
The graph offers a visual snapshot of which direction the core web vitals are moving and an explanation of the kind of trend for each metric.
The three kinds of trends are:
- Good And Improving
- Good And Stable
- Poor And Regressing
Screenshot Showing CWV Performance
A more comprehensive explanation of the data is to the right of the trend graph, with each metric identified by the circle, square, and triangle icons.
Screenshot Of Data Explanation
Loading Performance
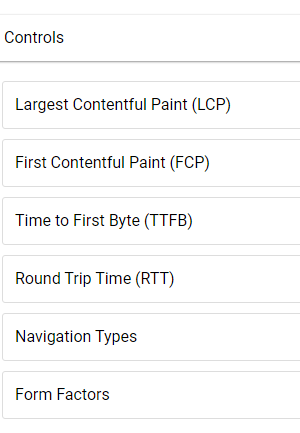
Using the left hand navigation to get to the Loading Performance screen shows another trend graph that offers additional metrics related to how fast the site or URL loads.
It offers the following six visualizations:
- Largest Contentful Paint (LCP)
- First Contentful Paint (FCP)
- Time to First Byte (TTFB)
- Round Trip Time (RTT)
- Navigation Types
- Form Factors
Screenshot Of Six Visualization Choices
There’s a toggle next to each choice:
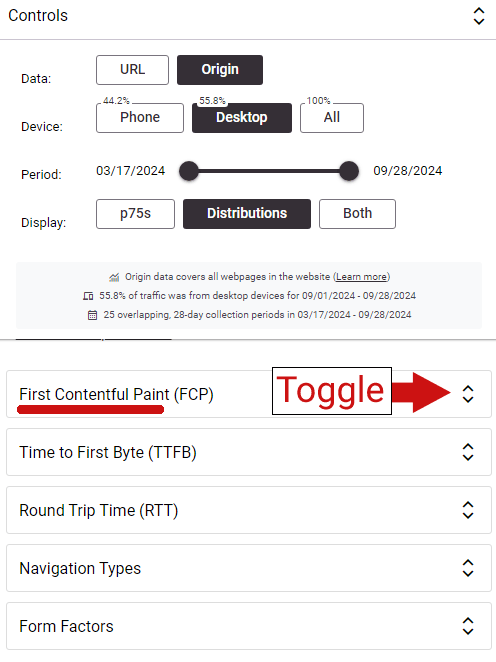
Clicking the toggle shows the trend graph:
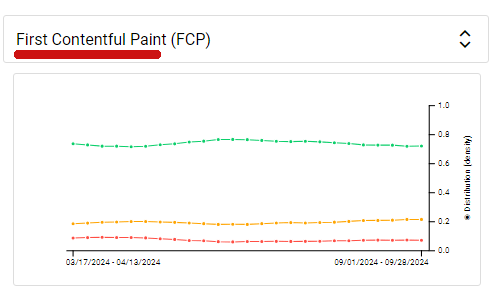
The rest of the choices show similar breakdowns of each kind of metric.
The new CrUX Vis tool should be useful to publishers and digital marketers who want to get an accurate measurement of website performance, visualized as a trend. It’s useful for competitior research and for website audits.
Go check it out at:
Featured Image by Shutterstock/Krakenimages.com