Paul Bradbury/OJO Images via Getty Images
The November 6th announcement of Blackstone’s (BX) take-private acquisition of Retail Opportunity Investments Corp. (ROIC) reignited speculation that retail real estate has become a hotbed for M&A activity. Blackstone’s purchase of ROIC comes close on the heels of numerous failed acquisition attempts of Whitestone REIT (WSR), which followed previous successful combinations of Kimco Realty (KIM) with RPT properties and Urstadt Biddle (UBA) with Regency Centers (REG).
The obvious question for REIT speculators: Who’s next?
In this Sector Spotlight, we review what remains of the very strong collection of shopping center REITs. We compare market valuations relative to AFFO/share, Net Asset Value (NAV), and 3Q24 Same Store Net Operating Income (SSNOI).
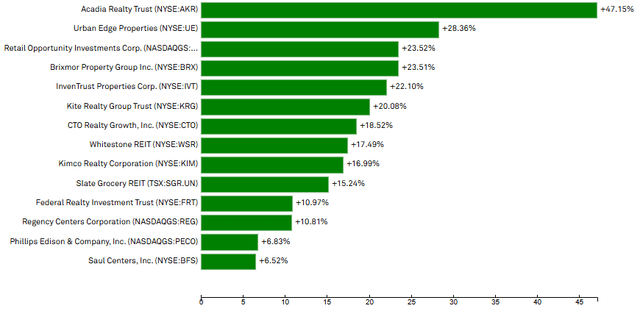
2024 Returns
Pre-pandemic, the US was deemed to be over-supplied in real estate for a retail sector being outcompeted by growing e-commerce. The COVID-era government-mandated shutdowns caused retail REITs to scramble for liquidity, and many had to slash or suspend payment of dividends. A very rough investment environment and share prices tumbled.
Starting in 2022, retail REITs began to show signs of life and growth potential. Thus far, 2024 has produced huge returns for the sector.
Shopping Center REITs: 2024 Total Returns through 11/08/2024
Market Valuations
Various metrics can be applied to understand a company’s intrinsic value relative to its market valuation. At Portfolio Income Solutions, we put significant trust in Adjusted Funds from Operations (AFFO/share) measures because they level the earnings playing field in a peer set. At present, the AFFO/share multiples of the shopping center REIT sector look like this.
2MCAC with data derived from S&P Capital IQ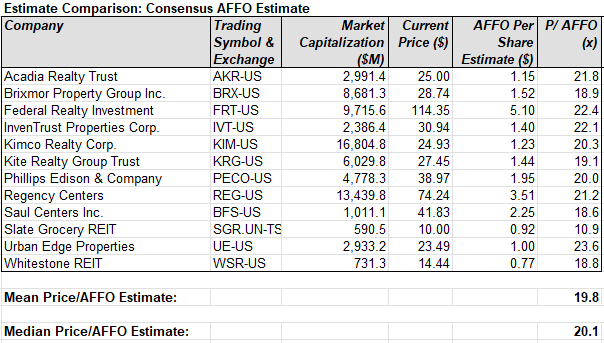
The shopping center sector average of 19.8x, 2024 consensus AFFO/Share is newly higher than the whole equity REIT universe average of 17.8x. The premium valuation is likely driven by many consecutive quarters of strong leasing and occupancy reporting from the retail sector. Dane Bowler elaborated on the forward earnings indications of Signed-Not-Open (SNO) leases in a recent SA article. It seems the operational supply/demand trend for quality retail space justifies the premium valuation and might also contribute to anticipation for further M&A.
Same Store Net Operating Income
Third quarter reporting indicated that while the industrial and multifamily sectors are still seeing strong demand, waves of competing new supply have suppressed both rent growth and occupancy. The result is a trend of more tepid SSNOI growth for those sectors. Strong demand, coupled with very little new supply, might indicate a longer runway for revenue growth for the retail sector. SSNOI is a harbinger for the sector’s pace of growth, and the 3Q24 average of 4.7% is impressive. Considering that the growing pipeline of SNO leases will help sustain NOI growth, you can understand the recent optimistic share price appreciation in retail REITs.
2MCAC with data derived from S&P Capital IQ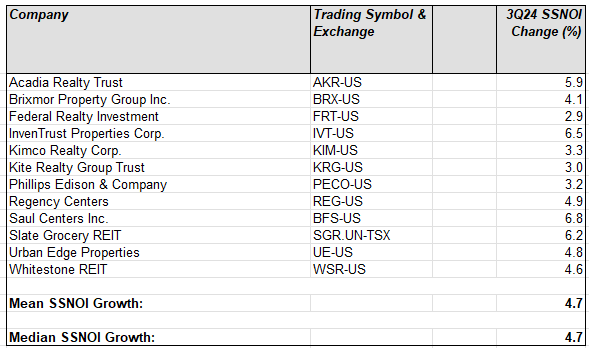
Net Asset Value
NAV is broadly considered a useful metric for comparison of value relative to market share price and to peers. Twelve months ago, retail REITs traded at an average discount of more than 20% to net asset value. Today they trade at close to NAV and at a slight premium to the whole equity REIT universe market pricing of 94.7% of NAV.
2MCAC with data compiled from S&P Capital IQ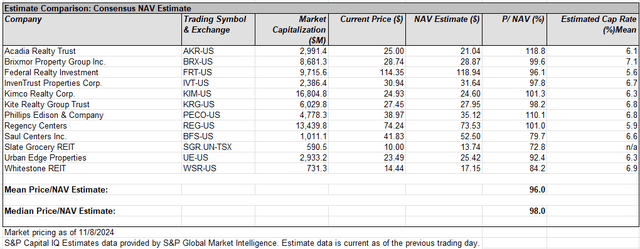
When considering NAVs, it is important to understand that the value is derived from using an assumed capitalization rate. As the table above describes, the applied Cap Rates vary widely. In this case, from 5.6% up to 7.1%; the lower the cap rate applied, the higher the NAV derived. We will bring the cap rate issue into fuller view on review of the BX / ROIC transaction.
Effective M&A
Rumors of the potential Blackstone purchase of ROIC emerged months ago, and we covered the story here. ROIC shares jumped on early speculation, but the terms of the deal were even juicier. In the Nov. 6 press release, BX acknowledged that the agreed upon $17.50 purchase price represented a 34% premium to pre-reporting prices. Employing the metrics from our Sector Spotlight tables above, we can compare the transaction to market values.
BX Buys ROIC for $17.50/Share
2MCAC with data compiled from S&P Capital IQ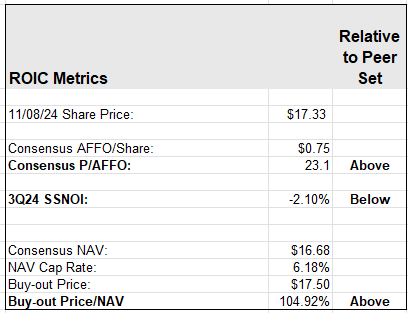
ROIC reported weaker SSNOI than peers for 3Q24, but Blackstone was still willing to pay a slight premium to sector AFFO multiple and NAV metrics to get the deal done. The premium might seem a little rich, but if you have witnessed BX’s prior full-cycle acquisition-to-monetization history, you can anticipate that Blackstone sees value beyond the market metrics.
Sector Value
We for some time have liked the retail REIT sector because the current supply/demand balance portends a secular rent growth trend. Sustaining rent and occupancy growth propel NOI. Higher NOI translates to NAV accretion. NAV accretion, with or without mergers and acquisitions, ultimately results in share price appreciation.
P/AFFO, NAV, and SSNOI are good peer set comparative metrics, but they are only a starting point. When you get to analyze individual companies, you must go much further in consideration of capitalization, management, sub-market demographics, macroeconomic trends, and a long list of other factors.
That said, the retail real estate sector currently has the investment potential to make further analysis worthwhile.


